Northern Latitudes: Currents and Water Sources in the Canadian Arctic

Northern Latitudes is a series examining how maps and mapmaking contribute to our work.
Currents are an important part of every marine ecosystem, and the Arctic is no exception. In the ocean, these steady streams of water range in size from large, broad currents such as the Gulf Stream, to smaller localized tidal currents along a coastline. These currents play an important role in regulating the Earth’s climate by moving heat from the equator towards the poles. They are also vital for marine inhabitants, replenishing nutrients and food, and carrying eggs or immobile species to new places.
Currents are mainly caused by wind pushing the surface of the water, but can also be triggered because of contrasts in water temperature, density, and pressure. They are influenced by the Earth’s rotation, through a phenomenon called the Coriolis effect. This deflects currents towards the right in the northern hemisphere and towards the left in the southern hemisphere, and helps drive the formation of large gyres, or circular spinning currents.
When we talk about currents, we need to think about them in three dimensions. Currents don’t just happen at the surface but down through the water column as well, where water is typically classified by its salinity and temperature. Deeper currents are driven by differences in salinity and temperature, and can drive upwelling or downwelling.
Currents also facilitate the mixing of different water types. In the Canadian Arctic, there are three main sources of water: fresh water arriving as snow, rain, or inflow from rivers; sea water from the North Pacific Ocean, and sea water from the North Atlantic Ocean. In this region, there is a net flow of water from west to east, which you can see in the currents map below, from Canada’s Arctic Marine Atlas. On the left side of the map, you can see half of the Beaufort Gyre that circles clockwise and drives sea ice from the Arctic Ocean against the islands in the north. You can also see the counter clockwise circulation pattern in Hudson Bay.
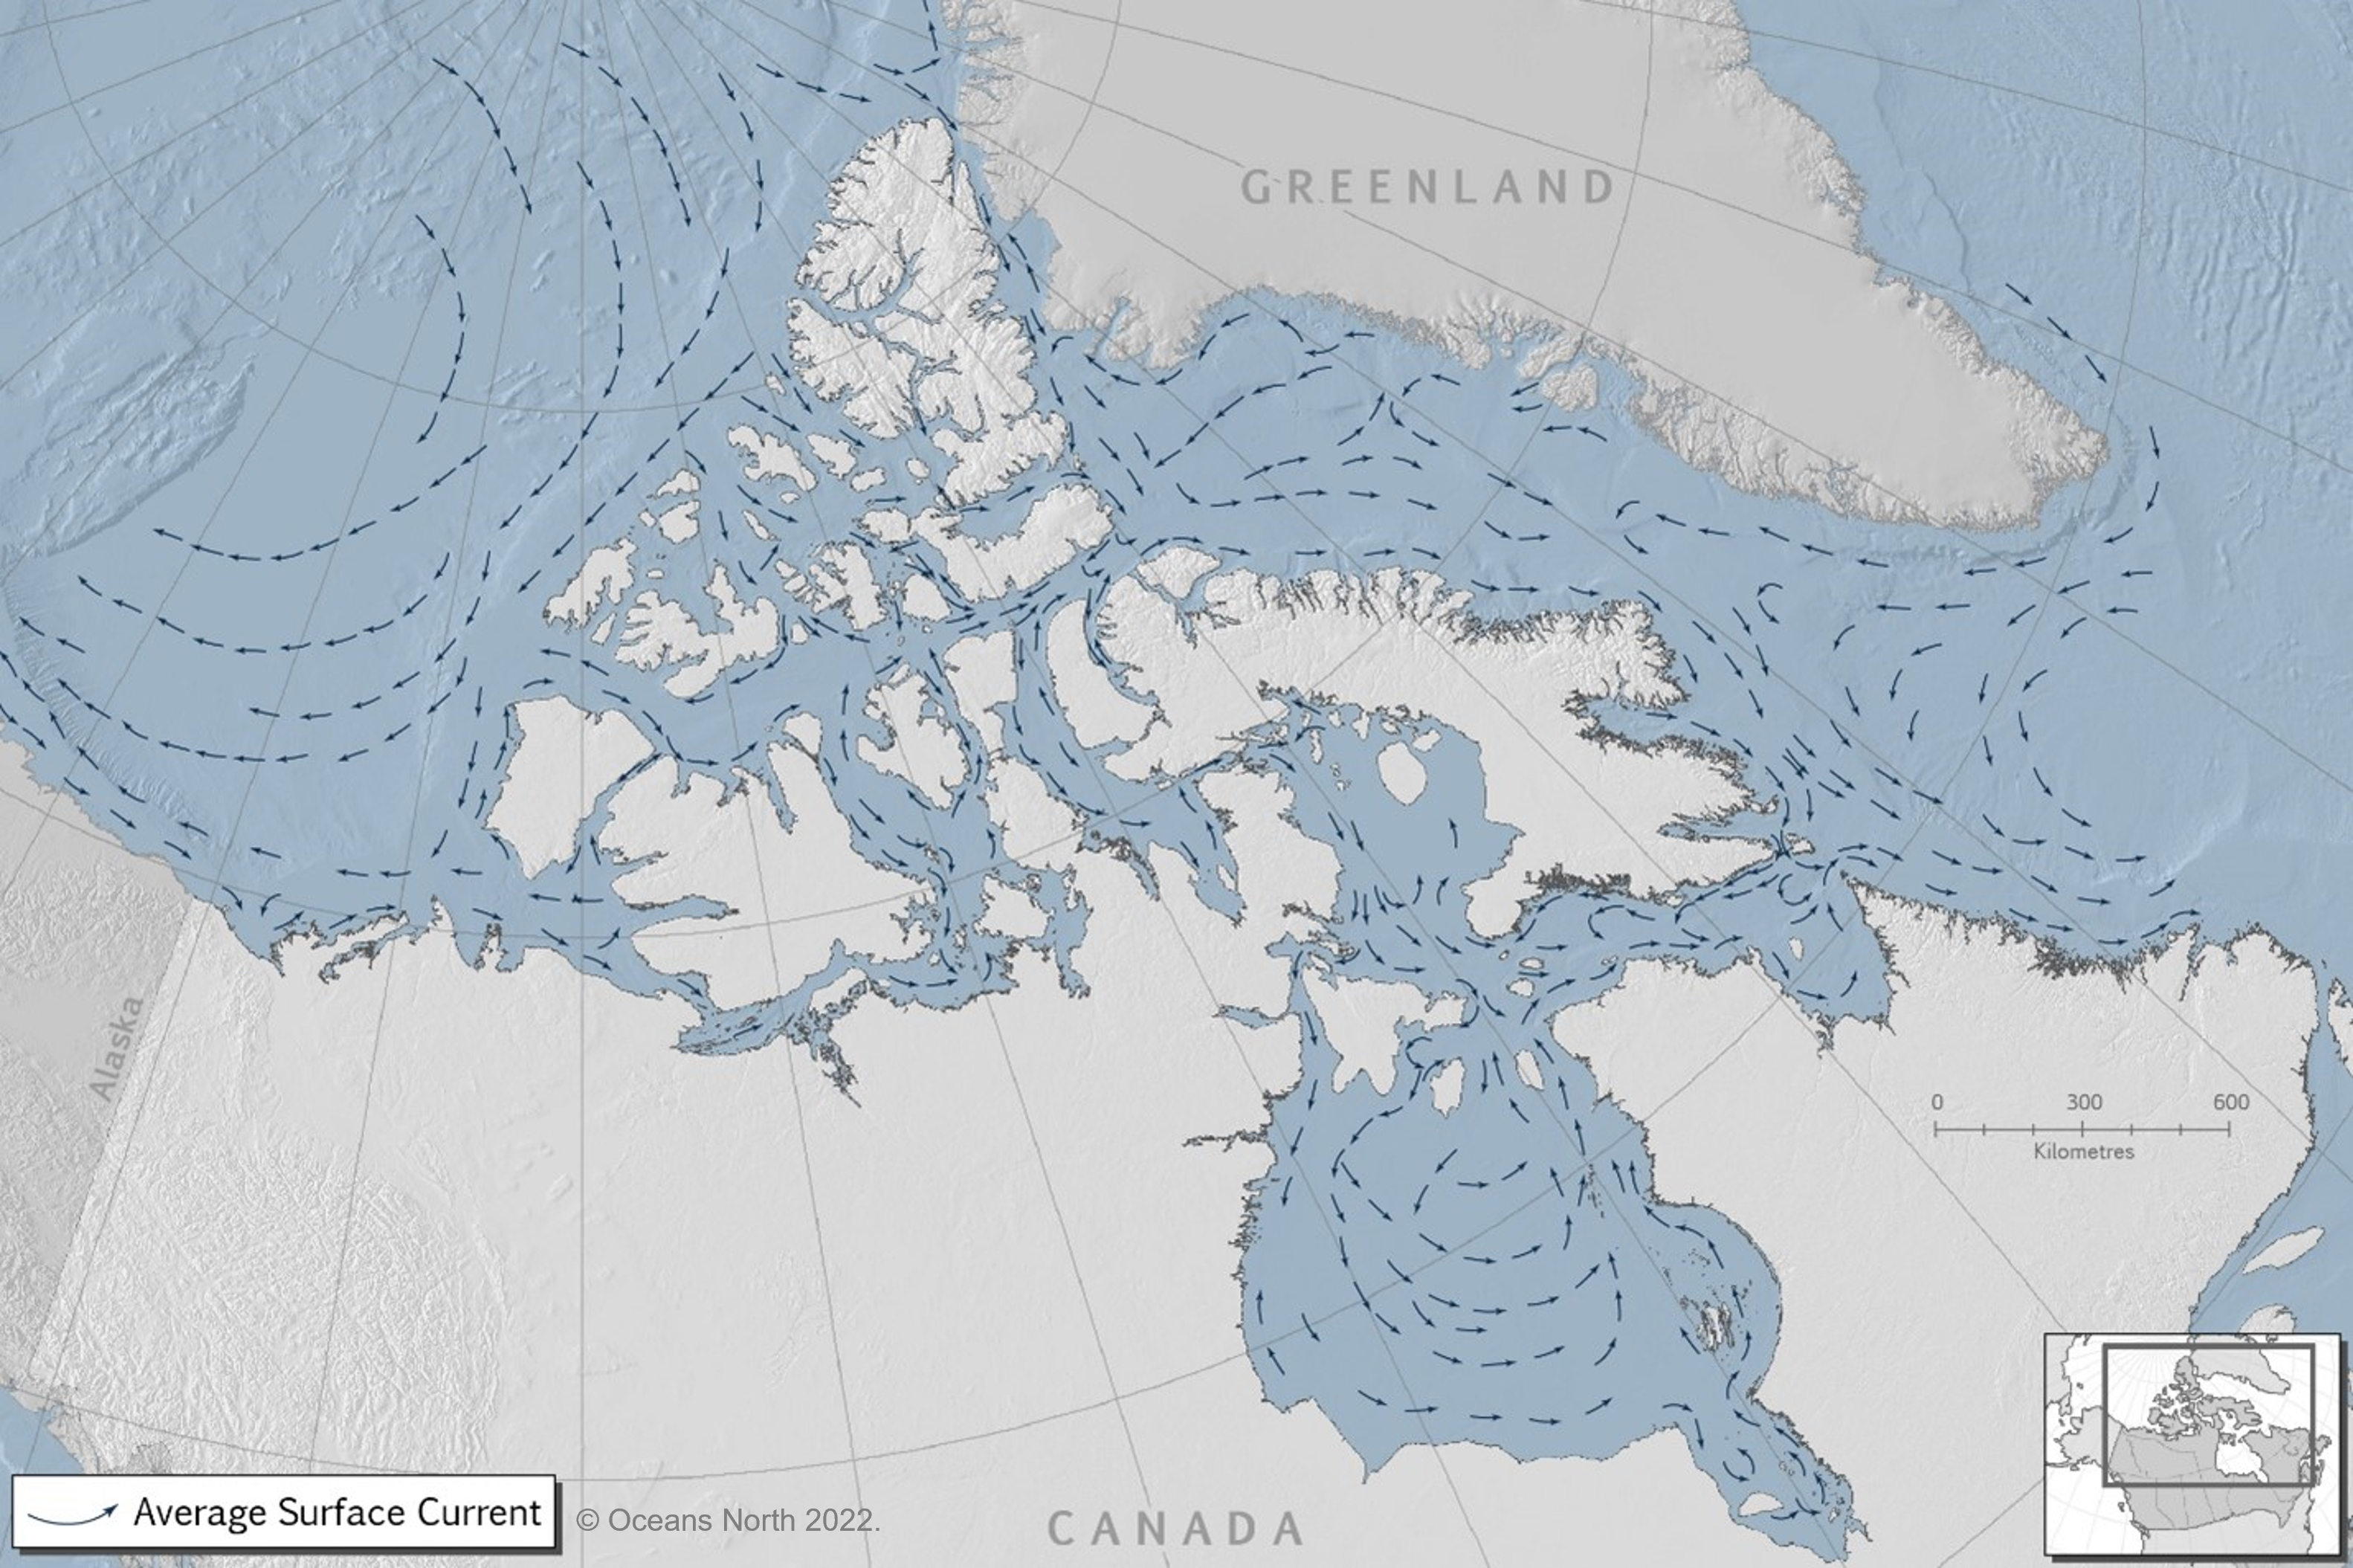
There are some caveats to accompany this map as it only shows the average surface currents for the region. However, actual currents may appear differently at a given time because this map is based on long-term studies, and does not include local effects, such as tides. It also does not capture volume or speed, nor does it show what’s happening deeper in the water column.
How do we map currents?
There are two different ways of studying ocean currents: remotely and in situ, meaning in place. Scientists can use satellite data to plot ocean currents using information such as sea surface height, sea and air temperature, and atmospheric conditions. In the Arctic, satellites are also used to track sea ice movement, which can be an indicator of ocean currents. As for in situ methods, scientists release buoys to drift in surface currents and relay their position back to shore with GPS and radio transmitters. Underwater robots can also be used to measure deeper ocean currents.
Scientists can use anything that gets caught in ocean currents to help map them – including rubber ducks. In 1992, a cargo ship spilled 29,000 rubber ducks and other bath toys into the North Pacific Ocean during a storm. These ducks ended up washing up on beaches around the world, as far away as northern Europe! Where they ended up, and how long it took them to get there, gave scientists great insight into ocean current pathways and helped them to confirm predictions made by computer-generated ocean current models.
For a visualization of ocean currents estimates that is updated every five days, check out Earth Null School: https://earth.nullschool.net/#current/ocean/surface/currents/ We also recommend looking at the Ocean Currents and Physical Oceanography sections of Canada’s Arctic Marine Atlas to delve into more information about Arctic water systems, sea ice, and Arctic storms.
Despite the historic satellite records, we are still uncertain about how climate change will affect water sources and currents in the Arctic. Factors such as wind patterns, inflow of fresh water, and water chemistry, all play a role in driving circulation and could change in the future. But monitoring these currents will provide clues about how this region is changing in the coming decades.
Olivia Mussells is the lead marine conservation geographer for Oceans North.
Related Content
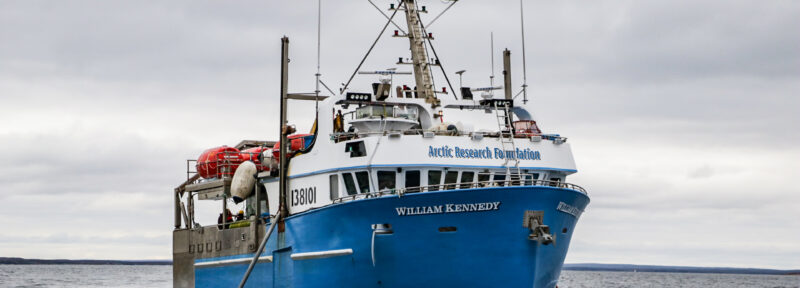
The Research Vessel William Kennedy.
Credit: Arctic Research Foundation
Research Expedition Gathers Long-Needed Data on James Bay Ecosystem
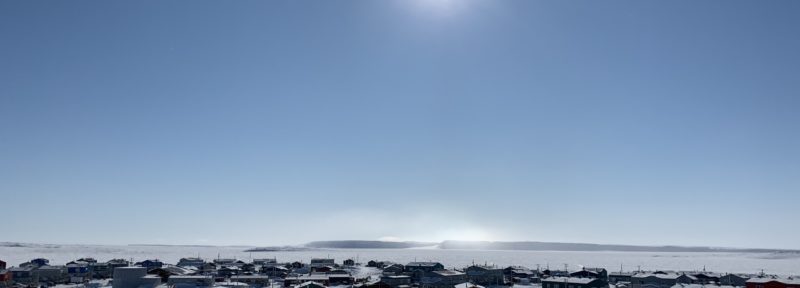
The community of Inukjuak, Nunavik in winter with frozen Hudson Bay in the distance.
Credit: Jennie Knopp
Marine Conservation in Inukjuak during COVID-19
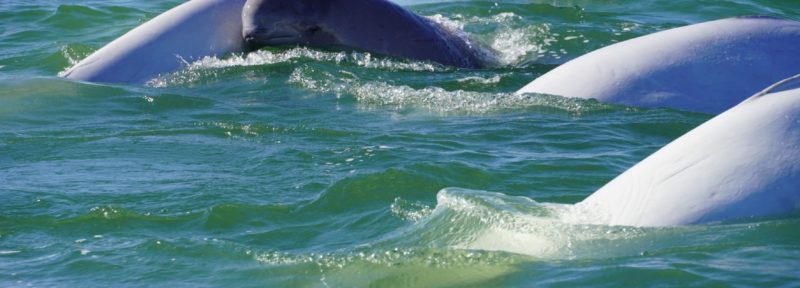
Learn about one of the greatest beluga migrations in the world.
Credit: Paul Labun
New Podcast Explores How To Protect Our Oceans
