Northern Latitudes: Observing a Warming Ocean
You may have heard the Arctic is warming at four times the rate of the rest of the world. That rise in temperatures also extends to the Arctic Ocean.
Scientists measure Sea Surface Temperature (SST), the temperature of the very top layer of the ocean, to understand how it’s warming or cooling. In the winter, when the Arctic Ocean is covered in ice, sea surface temperature hasn’t changed over the years; however, in the summer months, surface temperatures have been rising, and this is negatively impacting local communities and wildlife. While the rest of Canada’s oceans have been warming at a rate of 1°C per century, summer sea surface temperatures in the Arctic have increased 1°C per decade over the last two decades.
How does sea surface temperature change?
Both heat from the sun and warmer waters coming from southern latitudes cause sea surface temperatures to increase. Elsewhere in the world’s oceans, areas that don’t have sea ice soak up more of the sun’s rays. This can lead to a positive feedback loop: warmer water melts the sea ice, creating more areas of open water. Typically, sea ice reflects most solar radiation because of its lighter colour (called the albedo effect). Less sea ice in general means greater warming, which means delayed freeze-up in the fall and a further decrease in sea ice coverage. Then the cycle repeats itself.
The composite map below (Map 1) shows September SSTs in the Canadian Arctic for the past 10 years. Looking at these individual images from year to year, it is difficult to discern whether there has been a trend toward either warming or cooling over the decade.
To better understand and depict changes over time, we can use “anomaly” maps. Anomaly refers to the difference between a single temperature and expected temperatures based on the past climate.
Map 2 shows the SST anomaly for September 2022. In this case, the anomaly was calculated as the difference between the average SST in September 2022 as compared to the September average for the years 1985 to 1990. That five-year period is considered to be the baseline against which future years are compared.
Where the map is red, the temperature has increased. Where it’s blue, the temperature has decreased. It’s a lot easier to see the temperature changes in Map 2 compared to the composition of images in Map 1.
Sea surface temperature anomalies for September 2022.
ᐃᓕᓴᕆᔭᐅᔪᖅ: Olivia Mussells. Data Source: NOAA Coral Reef Watch. 2022, updated daily. NOAA Coral Reef Watch Version 3.1 Daily Global 5km Satellite SST Anomaly Annual Composites Product, Sept. 2022. College Park, Maryland, USA: NOAA Coral Reef Watch.
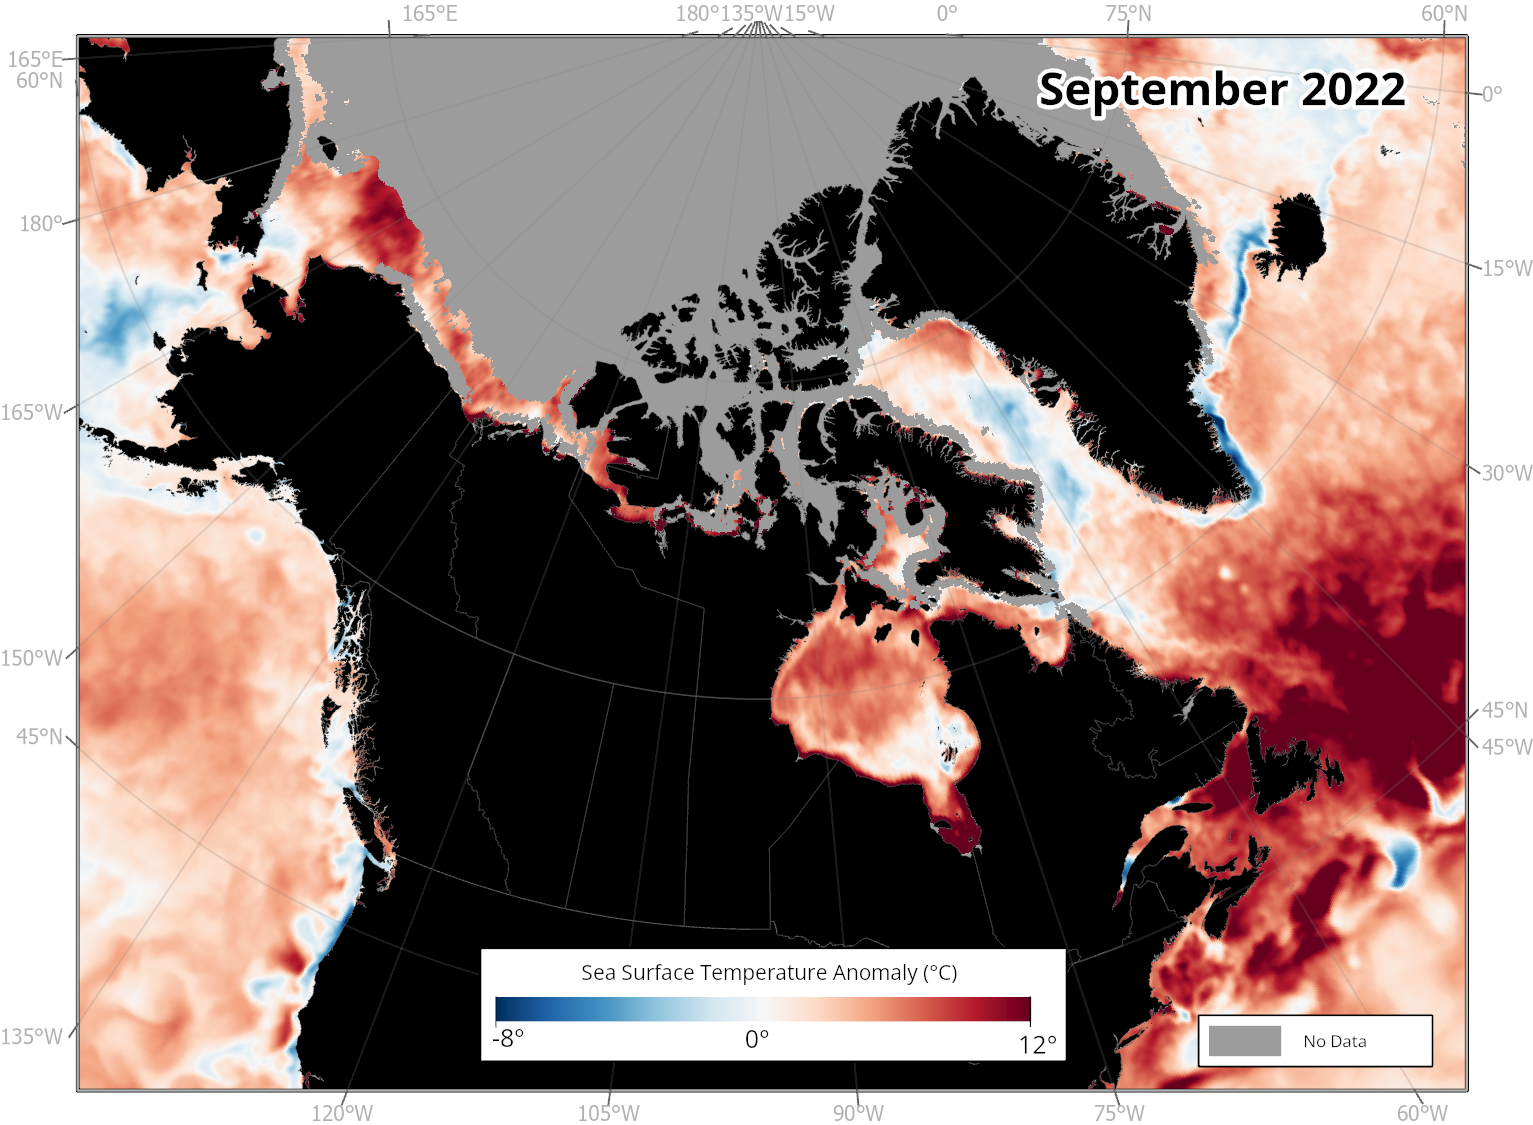
Calculating anomalies helps us better visualize change over time, as these temperature shifts are often too small to spot from year to year. In Map 2, you can see the strong warming trend in the Atlantic Ocean off the coast of Newfoundland, in southern James Bay and throughout the Arctic. Interestingly, there is a small cooling trend in Baffin Bay and Davis Strait.
How do we create these maps?
SST is calculated in a few different ways, including from field work, satellite imagery, and climate models. Temperature measurements taken in the field may be the most accurate way of knowing the SST in a particular location, but when you’re working with a large area, it’s not practical. Luckily, we’re able to use satellites to track SST. The SST maps above use Moderate Resolution Imaging Spectroradiometer (MODIS) instruments aboard NASA’s Terra and Aqua satellites to calculate SST.
Some SST maps are created using climate models. These are based on inputs from field work and satellite data and calculate the expected SST in a certain area based on other variables such as wind, bathymetry, and weather.
Why does sea surface temperature matter?
Sea surface temperature is an important variable for many ocean species—some of which can only live within certain temperature ranges. Changes to SST can shift the range of where some species live: some types may move north, or to deeper waters, in search of cooler temperatures. However, not all those species may even be able to adapt their ranges. Shorter sea ice seasons mean that light reaches the ocean depths sooner, prompting earlier and potentially larger phytoplankton blooms. Less sea ice also has significant consequences for species like polar bears that use ice to hunt and travel.
SST can impact communities as well. Certain species changing where they live can result in community members having to travel greater distances to hunt and harvest traditional foods. It can even lead to the complete loss of a food source. Thinner ice and shorter sea ice seasons can also lead to more unpredictable, riskier travel conditions, and means it often takes longer into the year before community members can get out on the ice.
Tracking changes in sea surface temperature is an important tool for understanding climate change and assessing how the Arctic environment is undergoing much more rapid change than the rest of the world.
Olivia Mussells is lead marine conservation geographer at Oceans North and is based in Ottawa.
Related Content
ᐃᒪᕐᒥᐅᑕᓂᑦ ᖃᐅᔨᓴᖅᑎ ᑯᕆᔅᑎᓐ ᐅᐊᔅᑕᓪ, ᑕᕆᐅᕐᔪᐊᓕᕆᔨᒃᑯᑦ ᐅᑭᐅᖅᑕᖅᑐᒥ, ᐃᖏᕐᕋᕗᖅ ᓯᑯᒥ ᐊᐅᓐᓂᑯᒥ ᑕᓯᕋᓛᒥ, ᒥᑦᑎᒪᑕᓕᖕᒥ, ᓄᓇᕗᑦ.
ᐃᓕᓴᕆᔭᐅᔪᖅ: ᑯᕆᔅᑎᓐ ᐅᐊᔅᑕᓪ
ᐅᑭᐅᖅᑕᖅᑐᒥ ᖃᐅᔨᓴᐃᓂᖅ ᐊᒻᒪ ᓄᓇᖃᖅᑳᖅᓯᒪᔪᑦ ᖃᐅᔨᒪᓂᖏᑦ
ᐃᑭᐊᖅᑭᕕᐅᑉ ᐱᒋᐊᕐᕕᖓᓄᑦ ᐅᖃᐅᓯᒃᓴᑦ: ᐱᑕᖃᐃᓐᓇᑎᑦᑎᓂᕐᒧᑦ ᐅᑭᐅᖅᑕᖅᑐᒥ ᐱᐅᖅᓱᐊᕐᓂᕐᒧᑦ ᐱᔾᔪᑎᖃᓲᖑᕗᖅ ᐱᐅᓂᖅᐹᓂ ᑐᑭᓯᒋᐊᕈᑎᓂ ᐃᑲᔪᖅᓱᕈᒪᔪᑦ ᖃᓄᐃᙱᑦᑎᐊᖅᑐᒥ ᐃᒪᕐᒥᐅᑕᓂᑦ ᐊᕙᑎᒥ ᐊᒻᒪ ᐃᖏᕐᕋᑦᑎᐊᖅᑐᓂ ᐅᑭᐅᖅᑕᖅᑐᒥ ᓄᓇᓕᖕᓂ.

Rankin Inlet’s youth arrived in Gillam to learn about the customs and traditions of Fox Lake Cree Nation.
ᐃᓕᓴᕆᔭᐅᔪᖅ: The Climate and Us
Creating Connections in Western Hudson Bay
ᐃᓕᓴᕆᔭᐅᔪᖅ: Oceans North
How Mapping Arctic Sea Ice Helps Monitor Climate Change